Debugging Flutter App Using DevTools
Flutter is an open-source Software Development Kit (SDK) for creating user interfaces. Maintained by Google, Flutter continues to evolve and improve. Flutter is a top choice for cross-platform development. Large applications will almost certainly encounter difficulties or defects that need to be debugged while using Flutter as a development kit.
In this guide, we’ll be discussing debugging in Flutter. You’ll see how to use Flutter’s debugging capabilities and learn how to utilize them in your apps. Let’s get started!
Debugging with Flutter:
When it comes to application debugging, Flutter offers a broad selection of tools and functionalities. Here’s a showcase of the main tools and features available:
-
DevTools: This is the primary tool for troubleshooting a Flutter app. It’s a browser-based set of performance and profiling tools, with new features and improvements added regularly.
-
In DevTools, the Logging view and Widget Inspector can be accessed using Android Studio, IntelliJ, or directly in your browser. The visual representation of widget trees can be checked using the inspector.
-
Using the numerous debug flags and methods provided by Flutter, you can troubleshoot various aspects of your app’s behavior. Compiling in debug mode is required to make use of these options.
Mega Bundle Sale is ON! Get ALL of our React Native codebases at 90% OFF discount 🔥
Get the Mega BundleImplementation Example
To get started, include the following in your code. The debug flags and some of their functions are covered in this section.
Importing the necessary Dart packages from Flutter is the first step.
import 'package:flutter/rendering.dart';
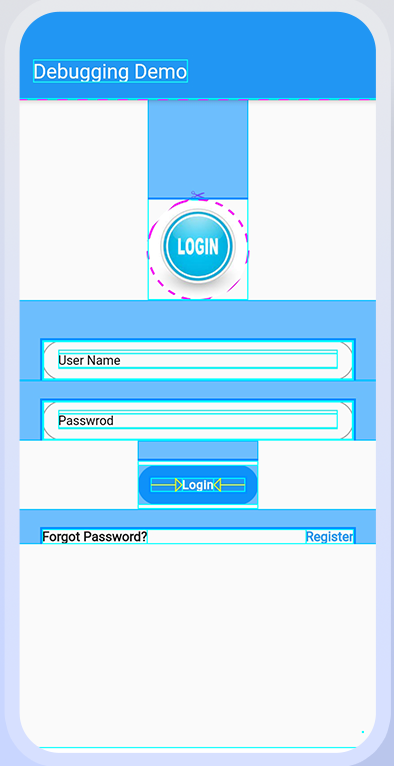
debugPaintSizeEnabled:
These colors and thick lines are used to bring attention to the render box surrounding the screen, which is a form of embed function that employs the paint size embed function. This is a useful tool for visualizing layout issues.
Let’s use a reference to assist us grasp this.
debugPaintSizeEnabled = true;
When the app is being debugged, we should be able to receive a screenshot like the one below.
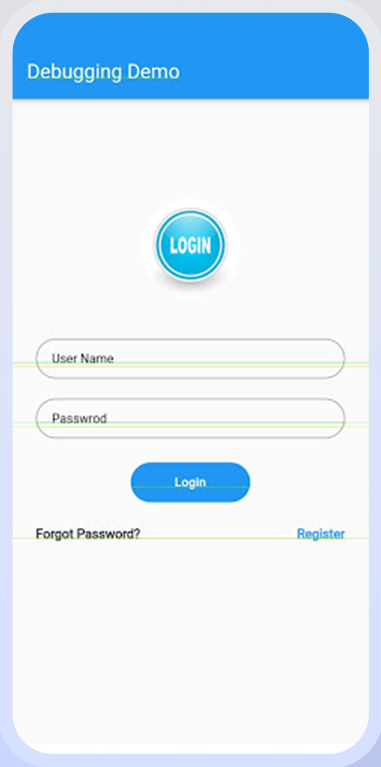
debugPaintBaseline Enabled:
The debugPaintBaselineEnabled flag marks each screen baseline with a painted line. Restart the program after adding the debugPaintBaselineEnabled option. This is helpful for text alignment debugging.
debugPaintBaselinesEnabled = true;
When the app is being debugged, we should be able to receive a screenshot like the one below.
Mega Bundle Sale is ON! Get ALL of our React Native codebases at 90% OFF discount 🔥
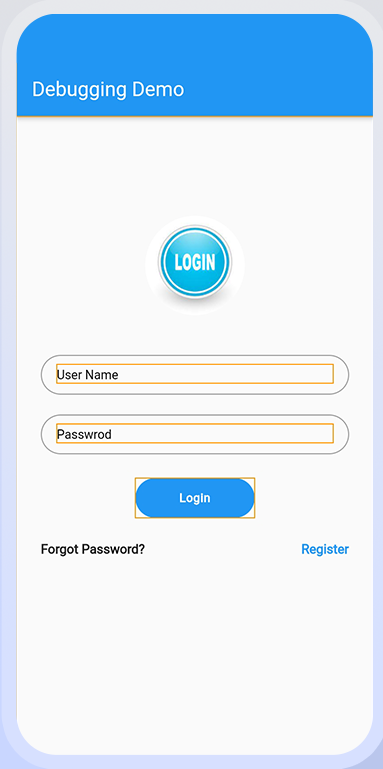
Get the Mega BundledebugPaintLayerBorderEnabled:
debugPaintLayerBordersEnabled makes each layer on the screen a box with a border and paints a line. Restart the app once you’ve added debugPaintLayerBordersEnabled.
Let’s use a reference to assist us grasp this.
debugPaintLayerBordersEnabled = true;
When the app is being debugged, we should be able to receive a screenshot like the one below.
debugRepaintRainbowEnabled:
You can enable the debugRepaintRainbowEnabled feature. A revolving set of colors is seen while repainting layers in checked mode after running debug mode. Then restart the program and add debugRepaintRainbowEnabled.
Let’s use a reference to assist us grasp this.
debugRepaintRainbowEnabled = true;
When the app is being debugged, we should be able to receive a screenshot like the one below.

Code File:
import 'package:flutter/material.dart';
import 'package:flutter_debugging_demo/shared/custom_button.dart';
import 'package:flutter_debugging_demo/shared/custom_text_field.dart';
import 'package:flutter_debugging_demo/themes/appthemes.dart';
import 'package:flutter_debugging_demo/themes/device_size.dart';
import 'package:flutter/rendering.dart';
class DebuggingDemo extends StatefulWidget {
_DebuggingDemoState createState() => _DebuggingDemoState();
}
class _DebuggingDemoState extends State<DebuggingDemo> {
Widget build(BuildContext context) {
debugPaintSizeEnabled = true;
debugPaintBaselinesEnabled = false;
debugPaintLayerBordersEnabled = false;
debugRepaintRainbowEnabled = false;
debugRepaintTextRainbowEnabled = false;
debugCheckElevationsEnabled = false;
debugDisableClipLayers = false;
debugDisablePhysicalShapeLayers = false;
debugDisableOpacityLayers = false;
return Scaffold(
appBar: AppBar(
title: Text('Debugging Demo'),
),
body: Container(
height: DeviceSize.height(context),
width: DeviceSize.width(context),
child: Column(
children: [
Container(
margin: EdgeInsets.only(top: 100),
//alignment:Alignment.bottomCenter,
child: ClipOval(
child: CircleAvatar(
backgroundColor: Colors.transparent,
maxRadius: 50,
child: Image.asset(
'assets/images/login.jpeg',
fit: BoxFit.cover,
width: DeviceSize.width(context),
),
),
),
),
Container(
padding: EdgeInsets.only(top: 40, left: 25, right: 25),
child: CustomTextField(
hintText: 'User Name',
type: TextInputType.text,
obscureText: false,
labelText: '',
),
),
Container(
padding: EdgeInsets.only(top: 20, left: 25, right: 25),
child: CustomTextField(
hintText: 'Passwrod',
type: TextInputType.text,
obscureText: true,
labelText: '',
),
),
Container(
margin: EdgeInsets.only(top: 20),
child: CustomButton(
callbackTertiary: () {
debugDumpApp();
},
color: Colors.blue,
mainButtonText: 'Login',
),
),
Container(
padding: EdgeInsets.only(top: 20, left: 25, right: 25),
child: Row(
mainAxisAlignment: MainAxisAlignment.spaceBetween,
children: [
Text(
'Forgot Password?',
style: TextStyle(fontSize: 13, fontWeight: FontWeight.w700),
),
Text(
'Register',
style: TextStyle(
color: Colors.blue,
fontSize: 13,
fontWeight: FontWeight.w700),
),
],
),
),
],
),
),
);
}
void debugDumpApp() {
assert(WidgetsBinding.instance != null);
String mode = 'RELEASE MODE';
assert(() {
mode = 'CHECKED MODE';
return true;
}());
debugPrint('${WidgetsBinding.instance.runtimeType} - $mode');
if (WidgetsBinding.instance.renderViewElement != null) {
debugPrint(WidgetsBinding.instance.renderViewElement.toStringDeep());
} else {
debugPrint('<no tree currently mounted>');
}
}
}
Looking for a custom mobile application?
Our team of expert mobile developers can help you build a custom mobile app that meets your specific needs.
Get in TouchConclusion:
Debugging in Flutter continues to improve, and the tools discussed here are up-to-date. We hope this guide helps you get started with Flutter’s debugging features. Try them out in your own apps!
Thank you for reading!